Using wall graphics that align with the curriculum can help strengthen the learning process by providing support for what students are being taught. By working with teachers, these designs can be customised to match the lessons, adding visual aids that complement educational plans.

To effectively integrate curriculum-aligned wall graphics into settings, consider the steps;
Steps for Aligning Wall Graphics with the Curriculum
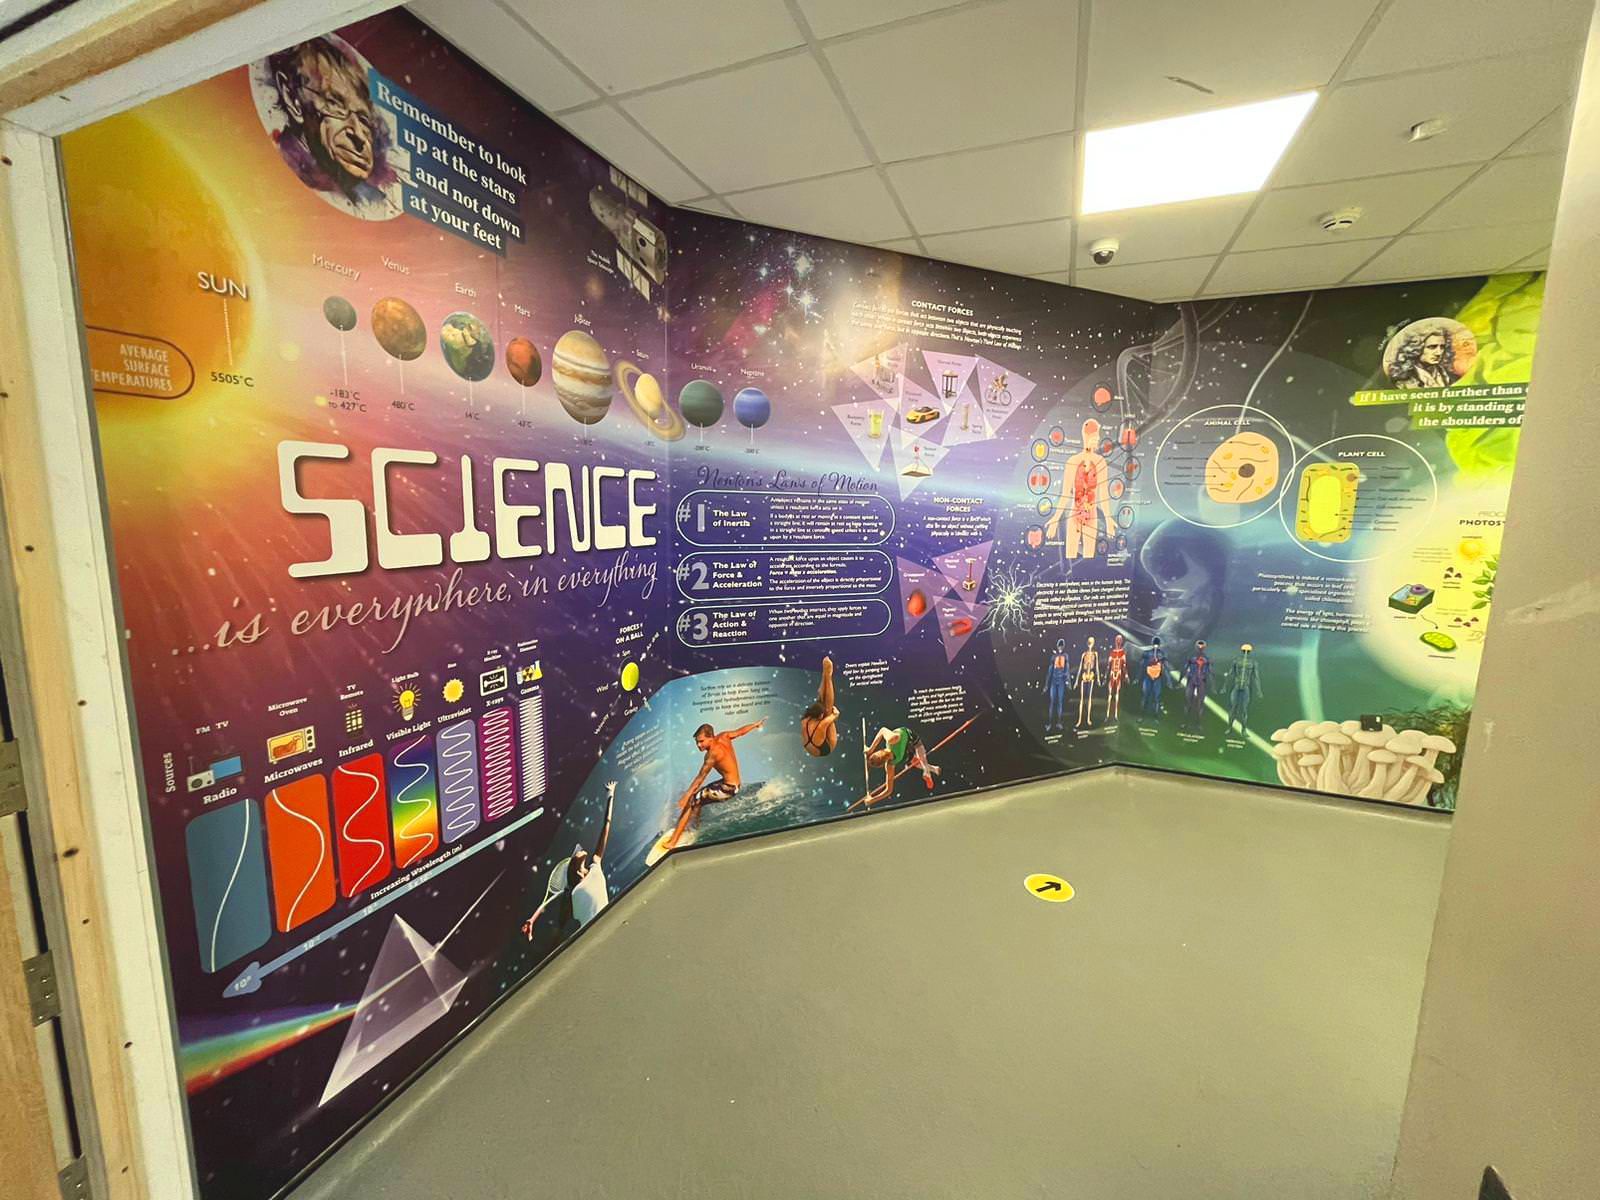
Incorporating Science Lab Graphics
1. Collaboration with Teachers;
- Initial Discussions: Conversed with educators and curriculum developers to grasp the covered topics and units.
- Continuous Communication: Establish a communication channel to keep abreast of subjects and themes suitable for visual representation.
2. Mapping Curriculum Objectives;
- Identifying Key Subjects: Collaborate with teachers to pinpoint subjects that would benefit from support in each discipline.
- Timeline Coordination: Develop a schedule outlining when specific topics will be taught throughout the year. Plan installations accordingly.
3. Integrating Design Elements;
- Visual Support: Create graphics that reinforce lesson content. For instance, during a biology lesson on ecosystems, wall graphics could showcase illustrations of biomes and food chains.
- Tools: Utilise visuals such as diagrams, charts and infographics to simplify ideas, aiding in better comprehension and retention.
Specific Subject Suggestions
Science;
- Biology: Visual aids depict cell structures, ecosystems and human anatomy with annotations for classroom support.
- Chemistry: For practical learning, utilise tables, molecular structures, chemical reaction pathways, and features like detachable components.
- Physics: diagrams illustrating forces, energy types and motion. Integrate reality elements to showcase principles through experiments.
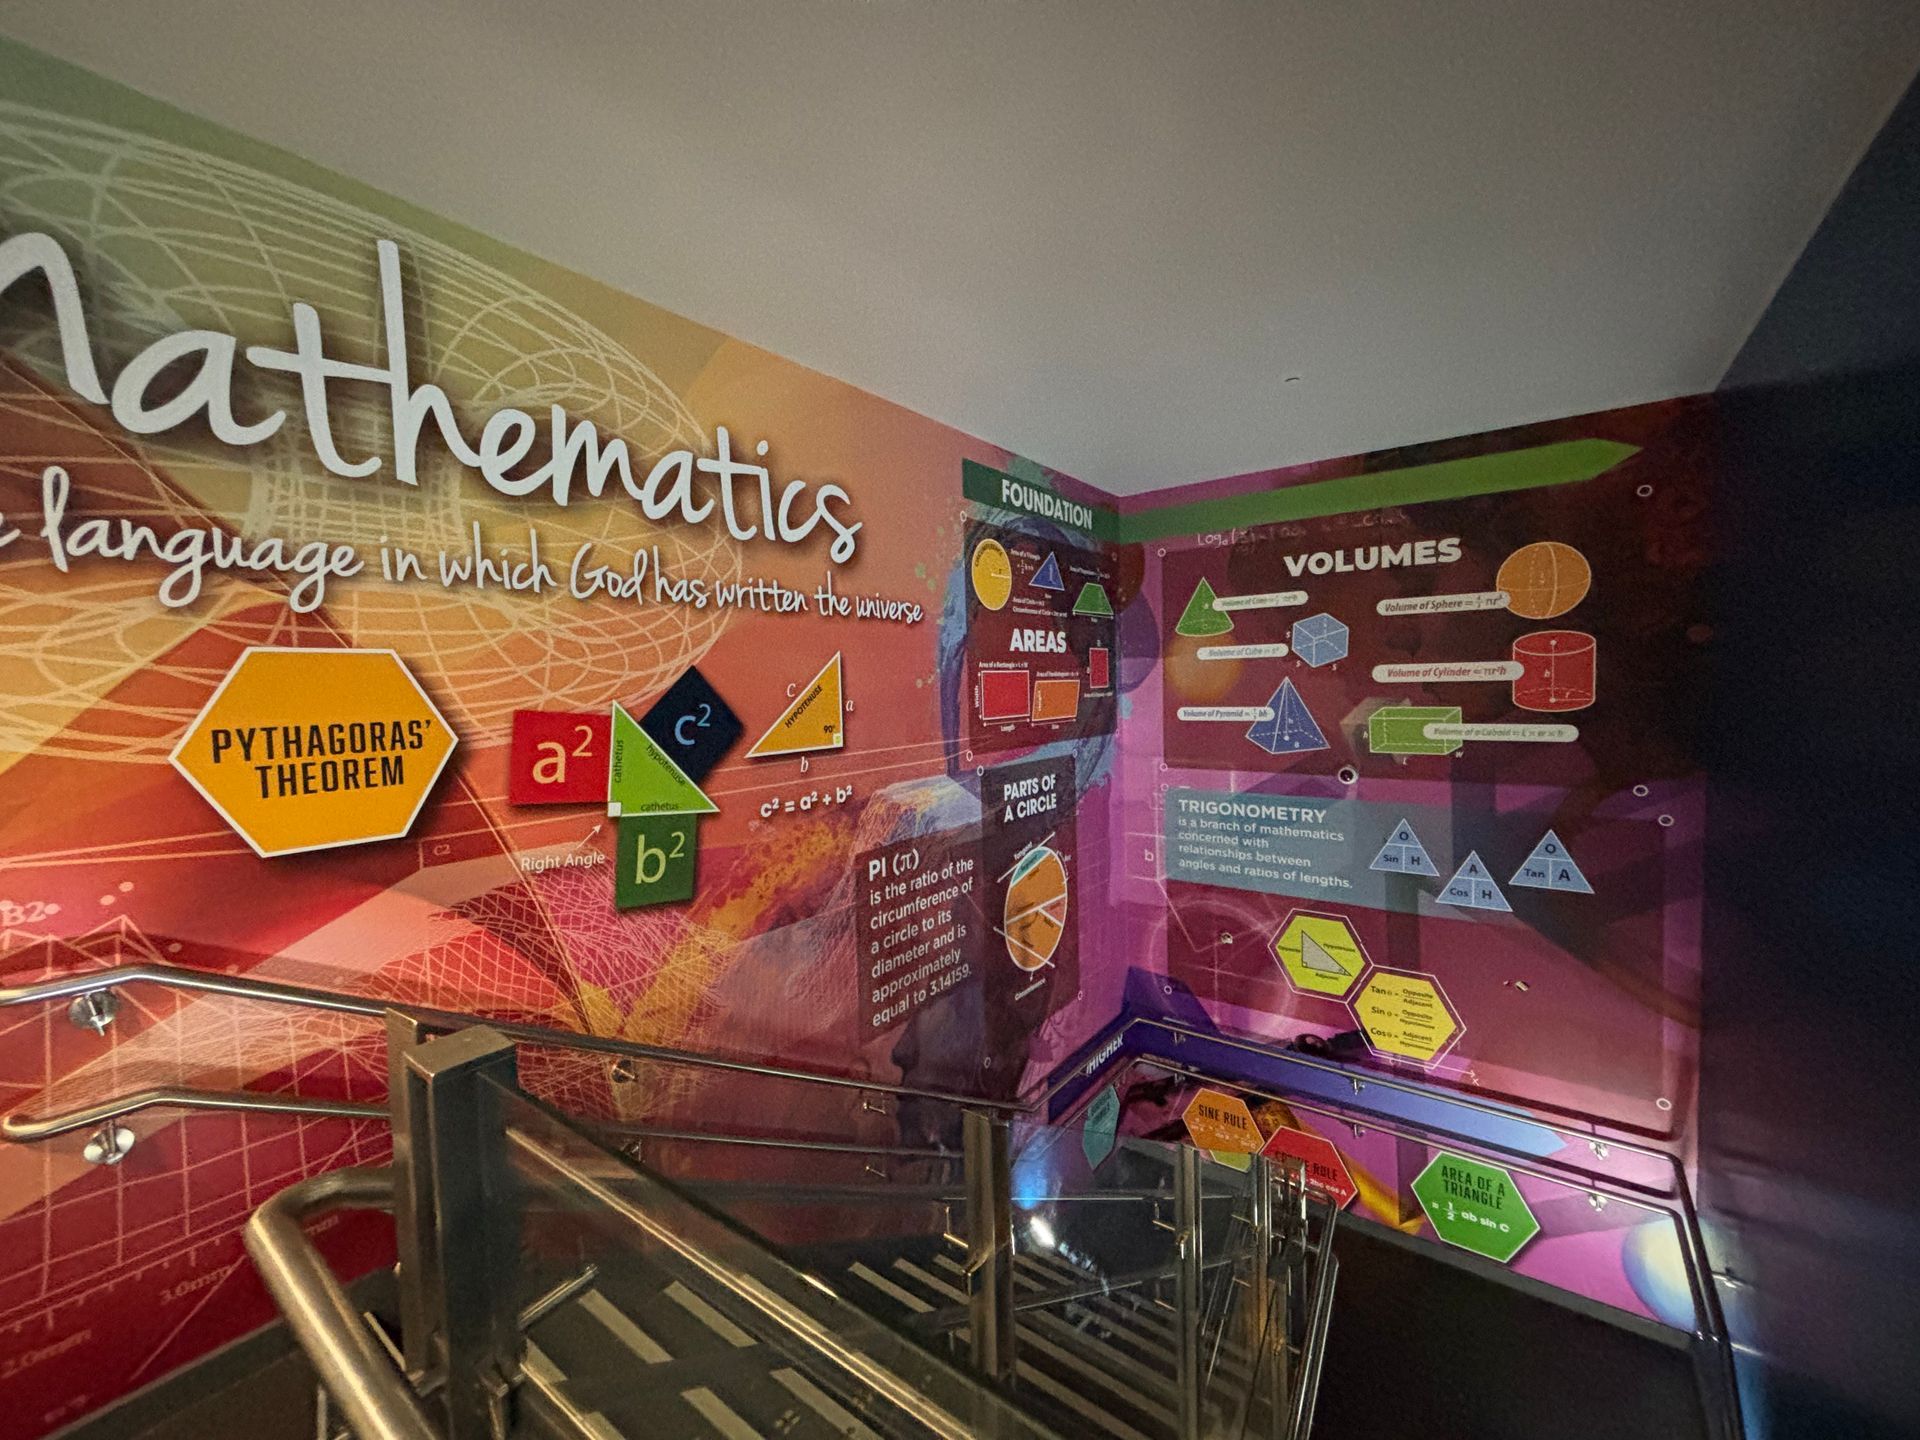
Mathematics;
- Geometry: Display geometric shapes, theorems and proofs on wall graphics using colours and layers to highlight relationships and characteristics.
- Algebra: Provide step-by-step solutions for equations and problems—Visualise concepts such as functions and graphing.
- Statistics; charts and graphs elucidating techniques, probability theories and data analysis methods.
History;
- Timelines: Offer detailed timelines of eras encompassing events, personalities and cultural advancements.
- Maps: Create maps showcasing shifts, trade routes, and exploration paths, with QR codes linking to resources and historical documents.
- Biographies: portraits and biographies of historical figures. Integrate reality elements for audio narratives and videos.
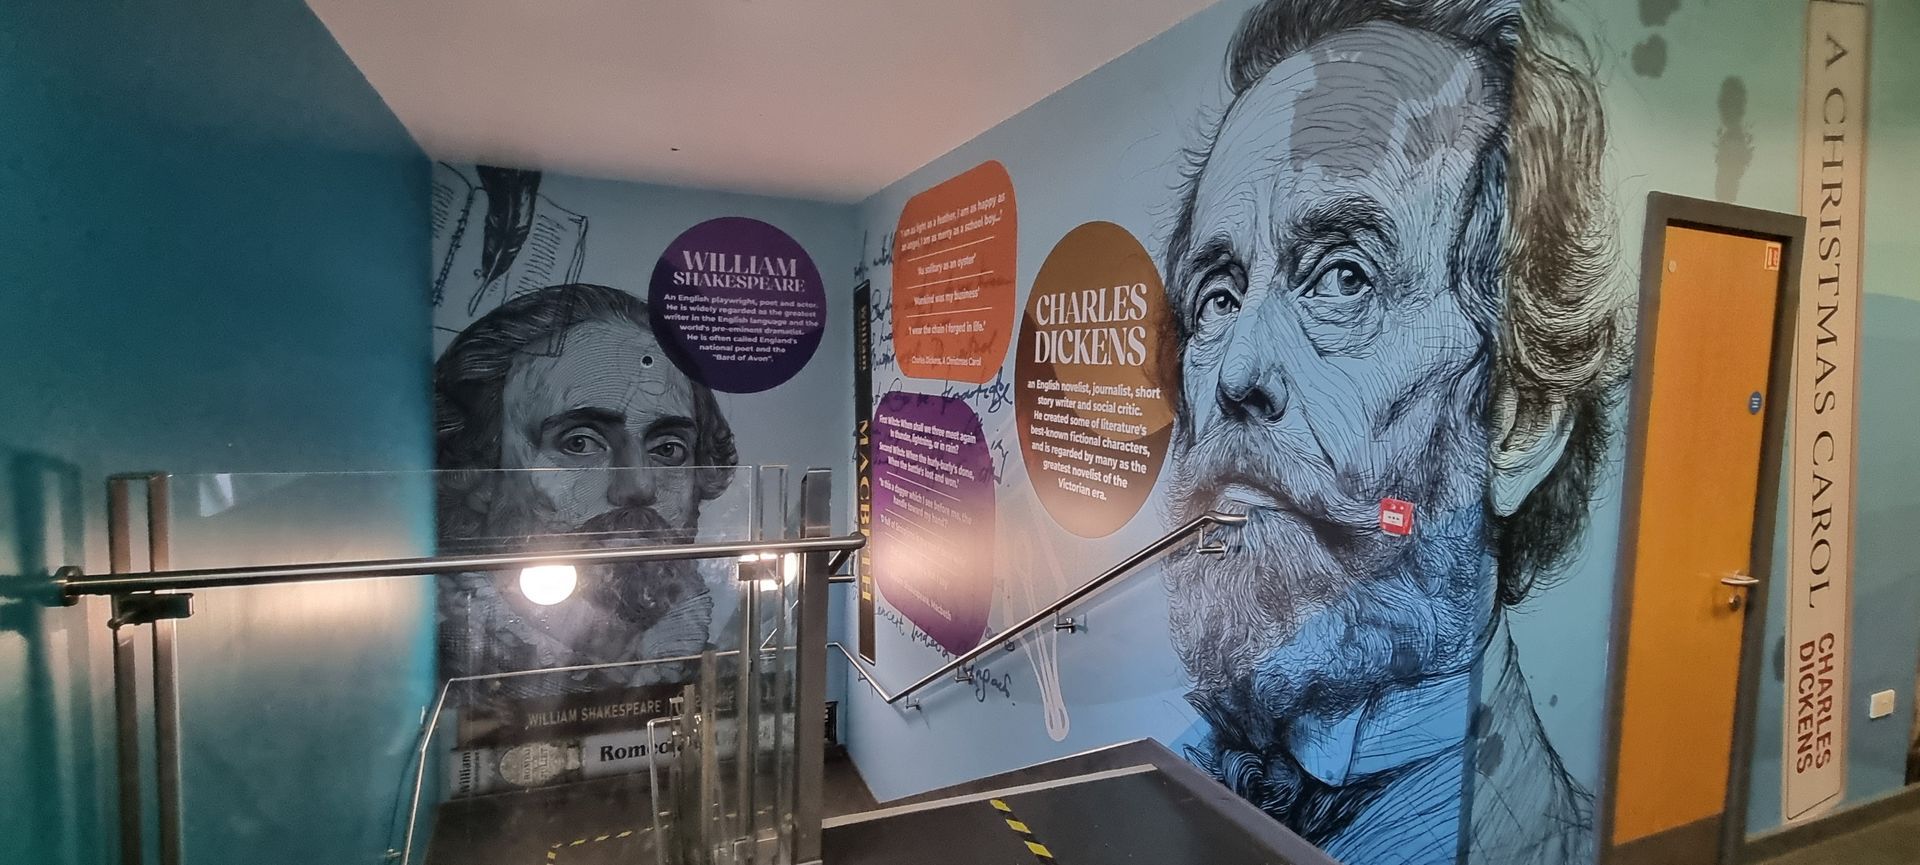
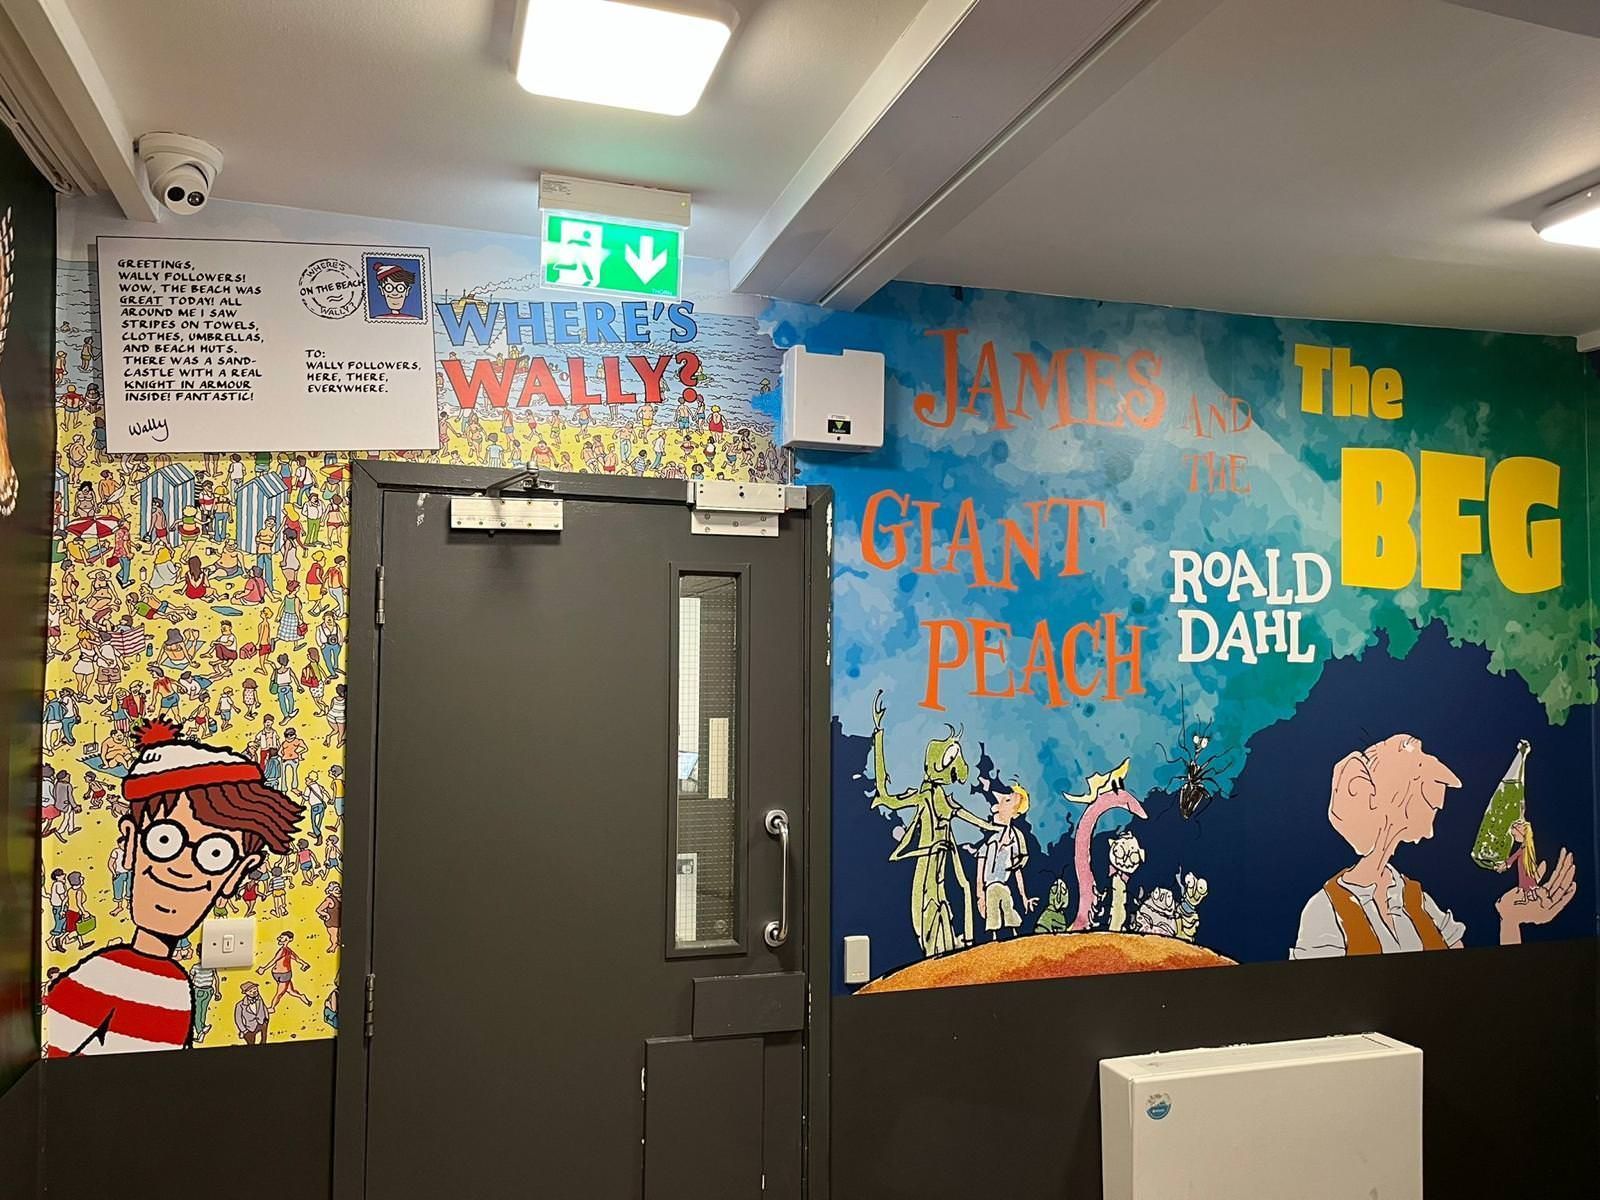
- The Language Arts section has illustrations representing periods and their defining characteristics. Each period includes information about authors and notable works from that era.
- For Grammar and Syntax, there are aids designed to explain grammar rules, sentence structures, and punctuation using colour-coded diagrams to help users understand complex regulations.
- The Creative Writing segment offers story maps and prompts intended to spark creativity in students. These resources provide spaces where students can contribute their ideas and writings.
- Moving on to Art, timelines showcase art movements highlighting key artists and their famous pieces. The timelines also focus on techniques and artistic styles prevalent during each movement.
- For Technique Guides, step-by-step instructions are provided for various art techniques, from drawing to painting. Student artwork is used as an example to demonstrate these techniques.
Students' creativity. These resources provide spaces for students to contribute their ideas and writing.
- The Gallery Space features areas for student exhibitions that change regularly. This space serves as a platform for students to display their work, fostering expression among them.
In terms of Interactive Elements, AR Integration is incorporated and connects to content like videos, animations, and interactive quizzes. Writable surfaces allow students to write, draw, or solve problems using erasers or chalkboard paint in designated areas. Touch-using markers, activated displays offer panels that respond to touch interactions by providing feedback and more information.